


The Secret to Healthy Soil: Unveiling the 2023 Fall Project Findings
Plant tissue testing provides accurate, real-time measurements to inform your decision-making throughout the growing...

Dr. Jim Friedericks’ Promoted to Director of Laboratory Quality & Research
AgSource is thrilled to share Dr. Jim Friedericks' promotion to Director of Laboratory Quality...
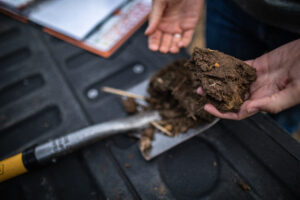
How are dry weather conditions affecting soil fertility?
With season-long drought conditions, concerns arise about nutrient availability in the soil and challenges...
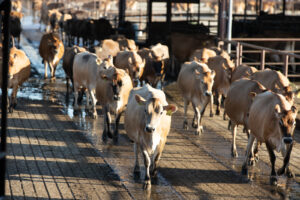
How to monitor heat stress using your DHI Herd Summary Report
See where losses from heat stress are occurring and determine the profitability of investing...


